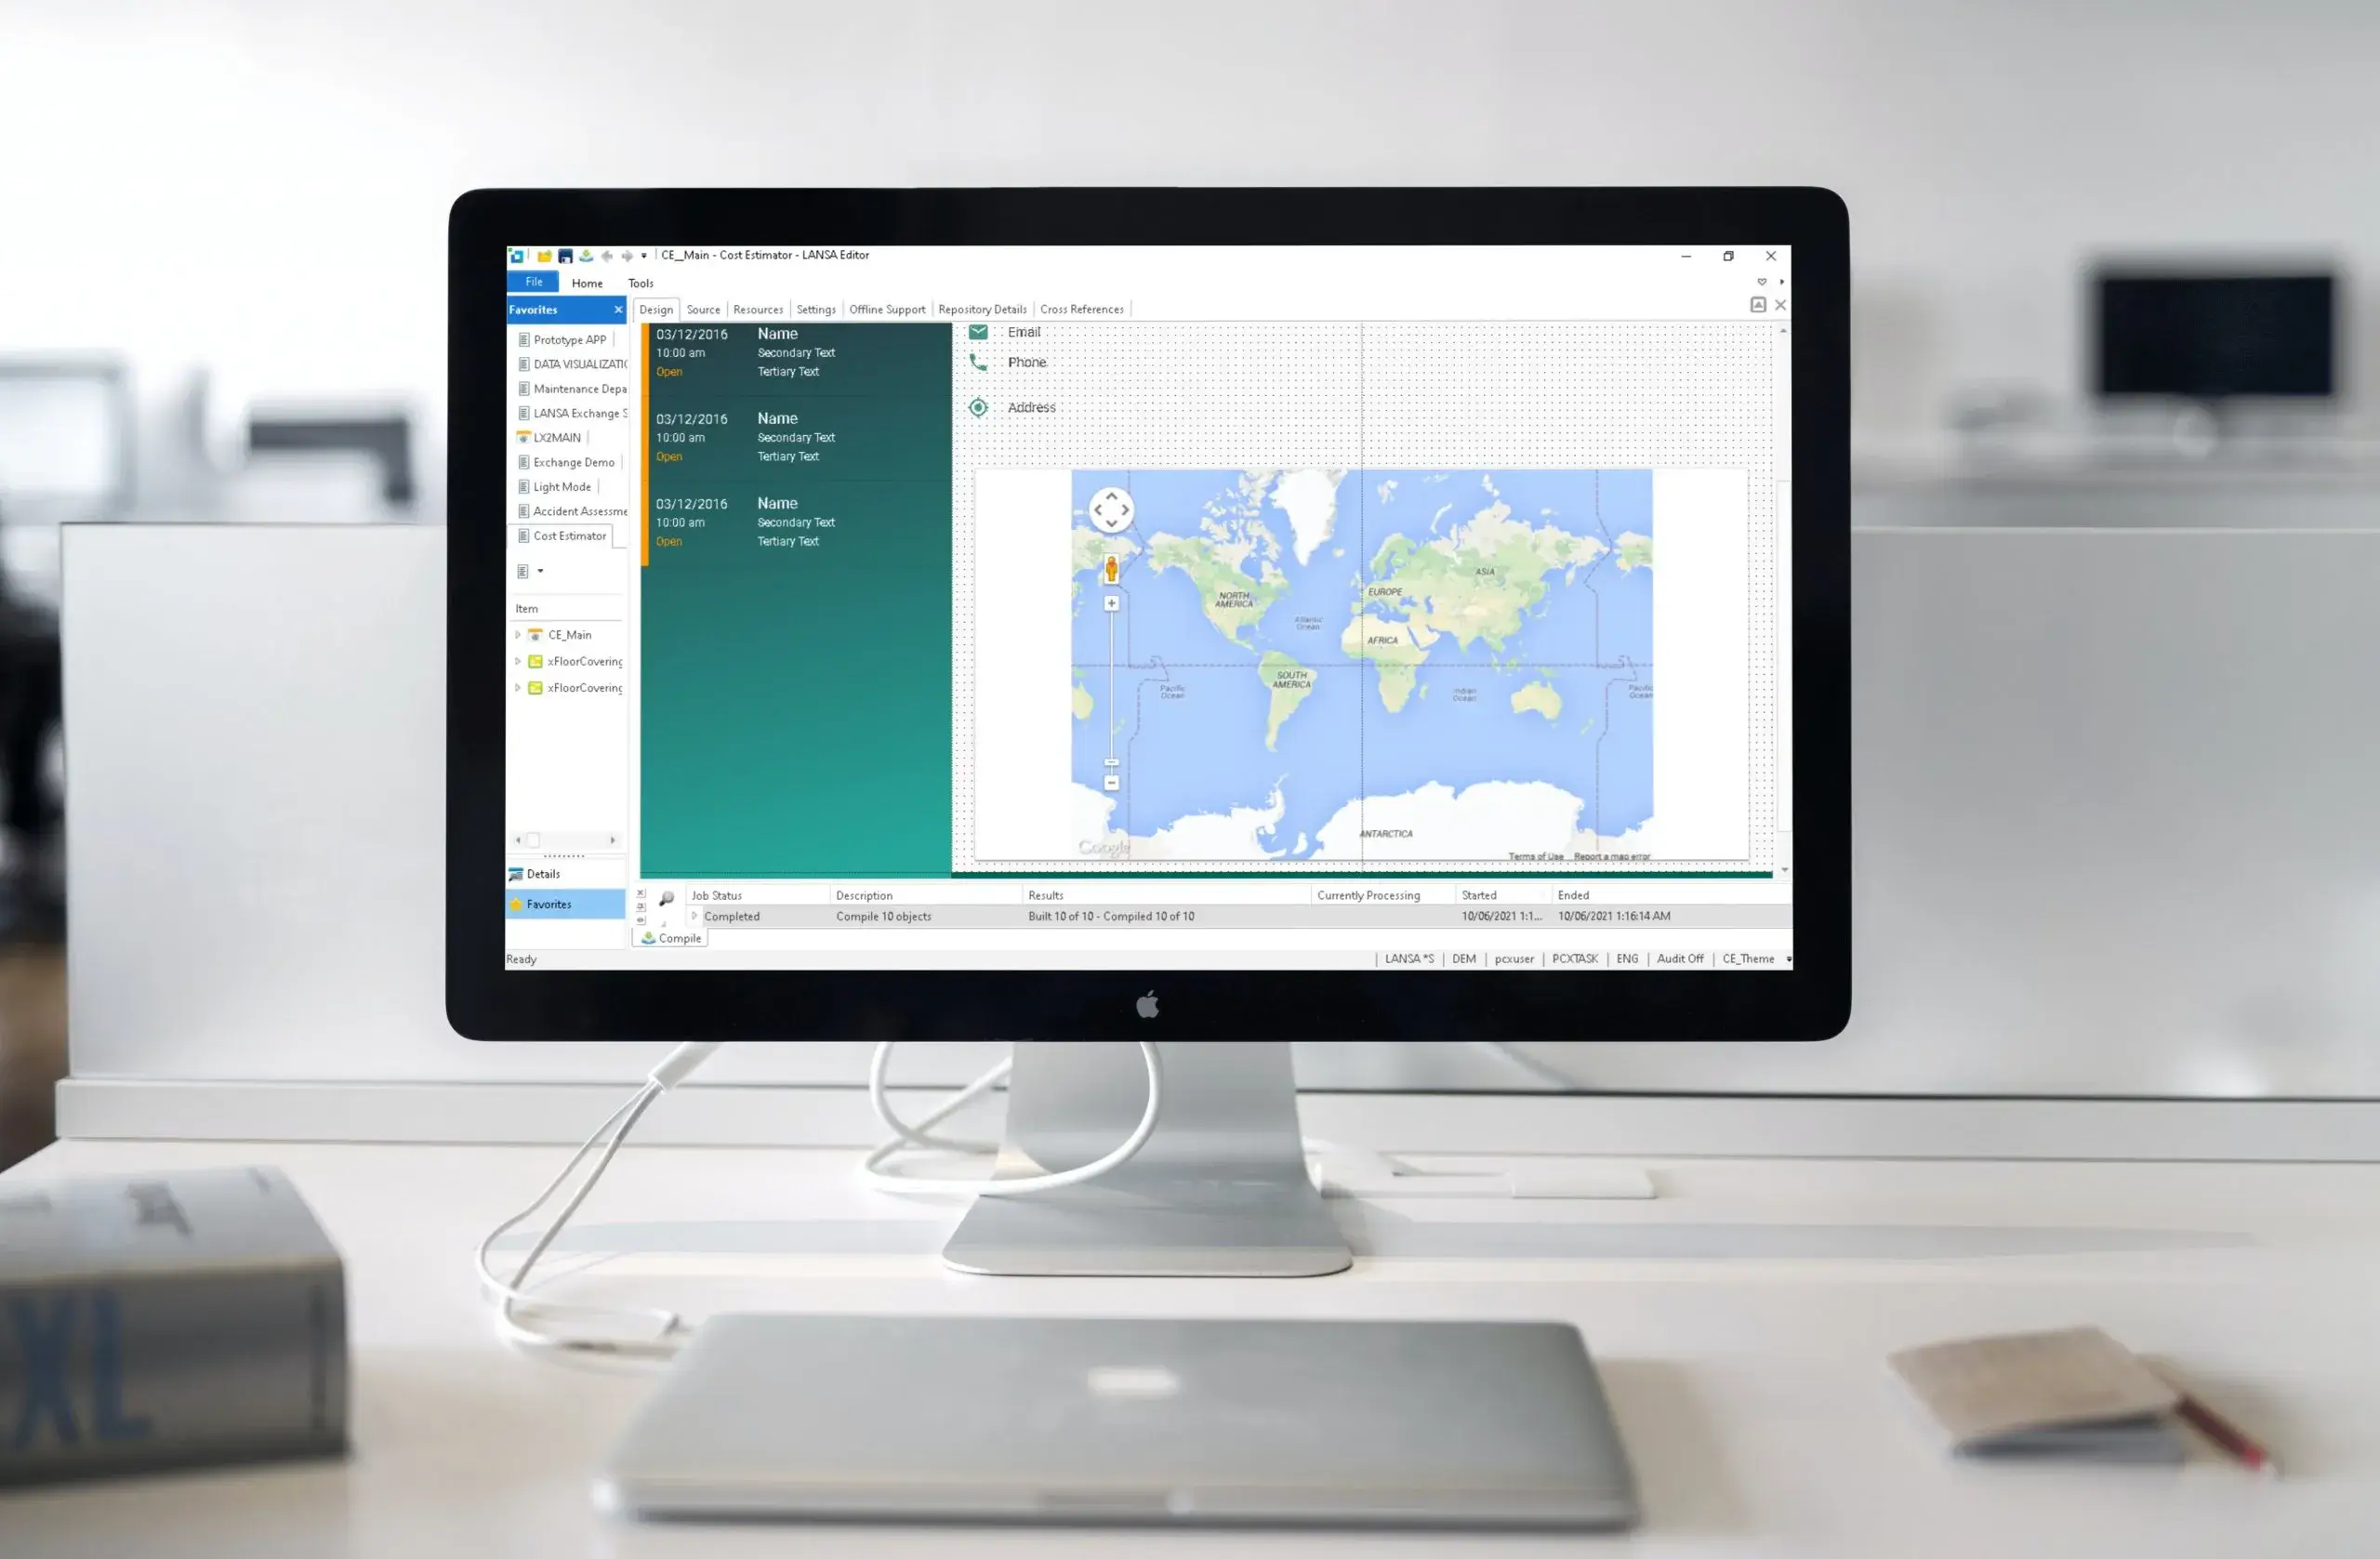
Visual LANSA empowers businesses by allowing them to create powerful logistics data visualizations with low-code.
Why is this important? It is important because with supply chains evolving rapidly, at a rate equal to or outpacing other technologies, the possibilities for a data-driven, automated, logistics vision is becoming reality much sooner than expected. As a result of the rapid increase in available technology, companies want to implement advancements in logistics more quickly than ever before. This means an increasing number of development initiatives in the coming months as businesses strive to keep up with current with technology and implement and upgrade their supply chain management systems and processes accordingly. Simply put, decision-makers can already see a future where product shipping and transportation are unmanned and happen with a single click and they want to make it happen now. Low-code platforms can provide an onramp for your digital transformation and application modernization initiatives.
What is Data Visualization?
So where does data visualization come into the equation? As you know, data visualization is the graphic representation of information and also data. The emergence of data visualization tools, which use visual elements such as charts, graphs, and maps to identify and understand trends, outliers, and patterns in data, makes it easier for analysts to identify these patterns and benefit from the information they provide.
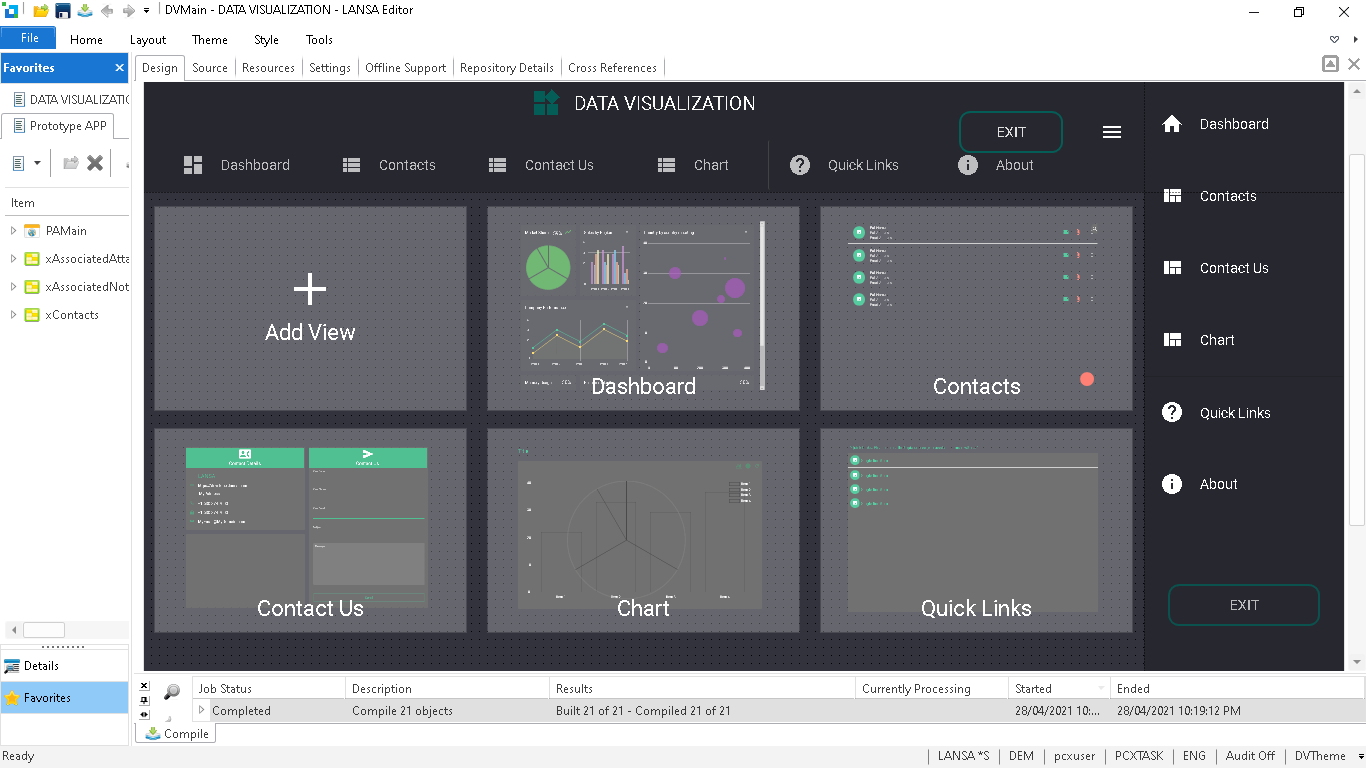
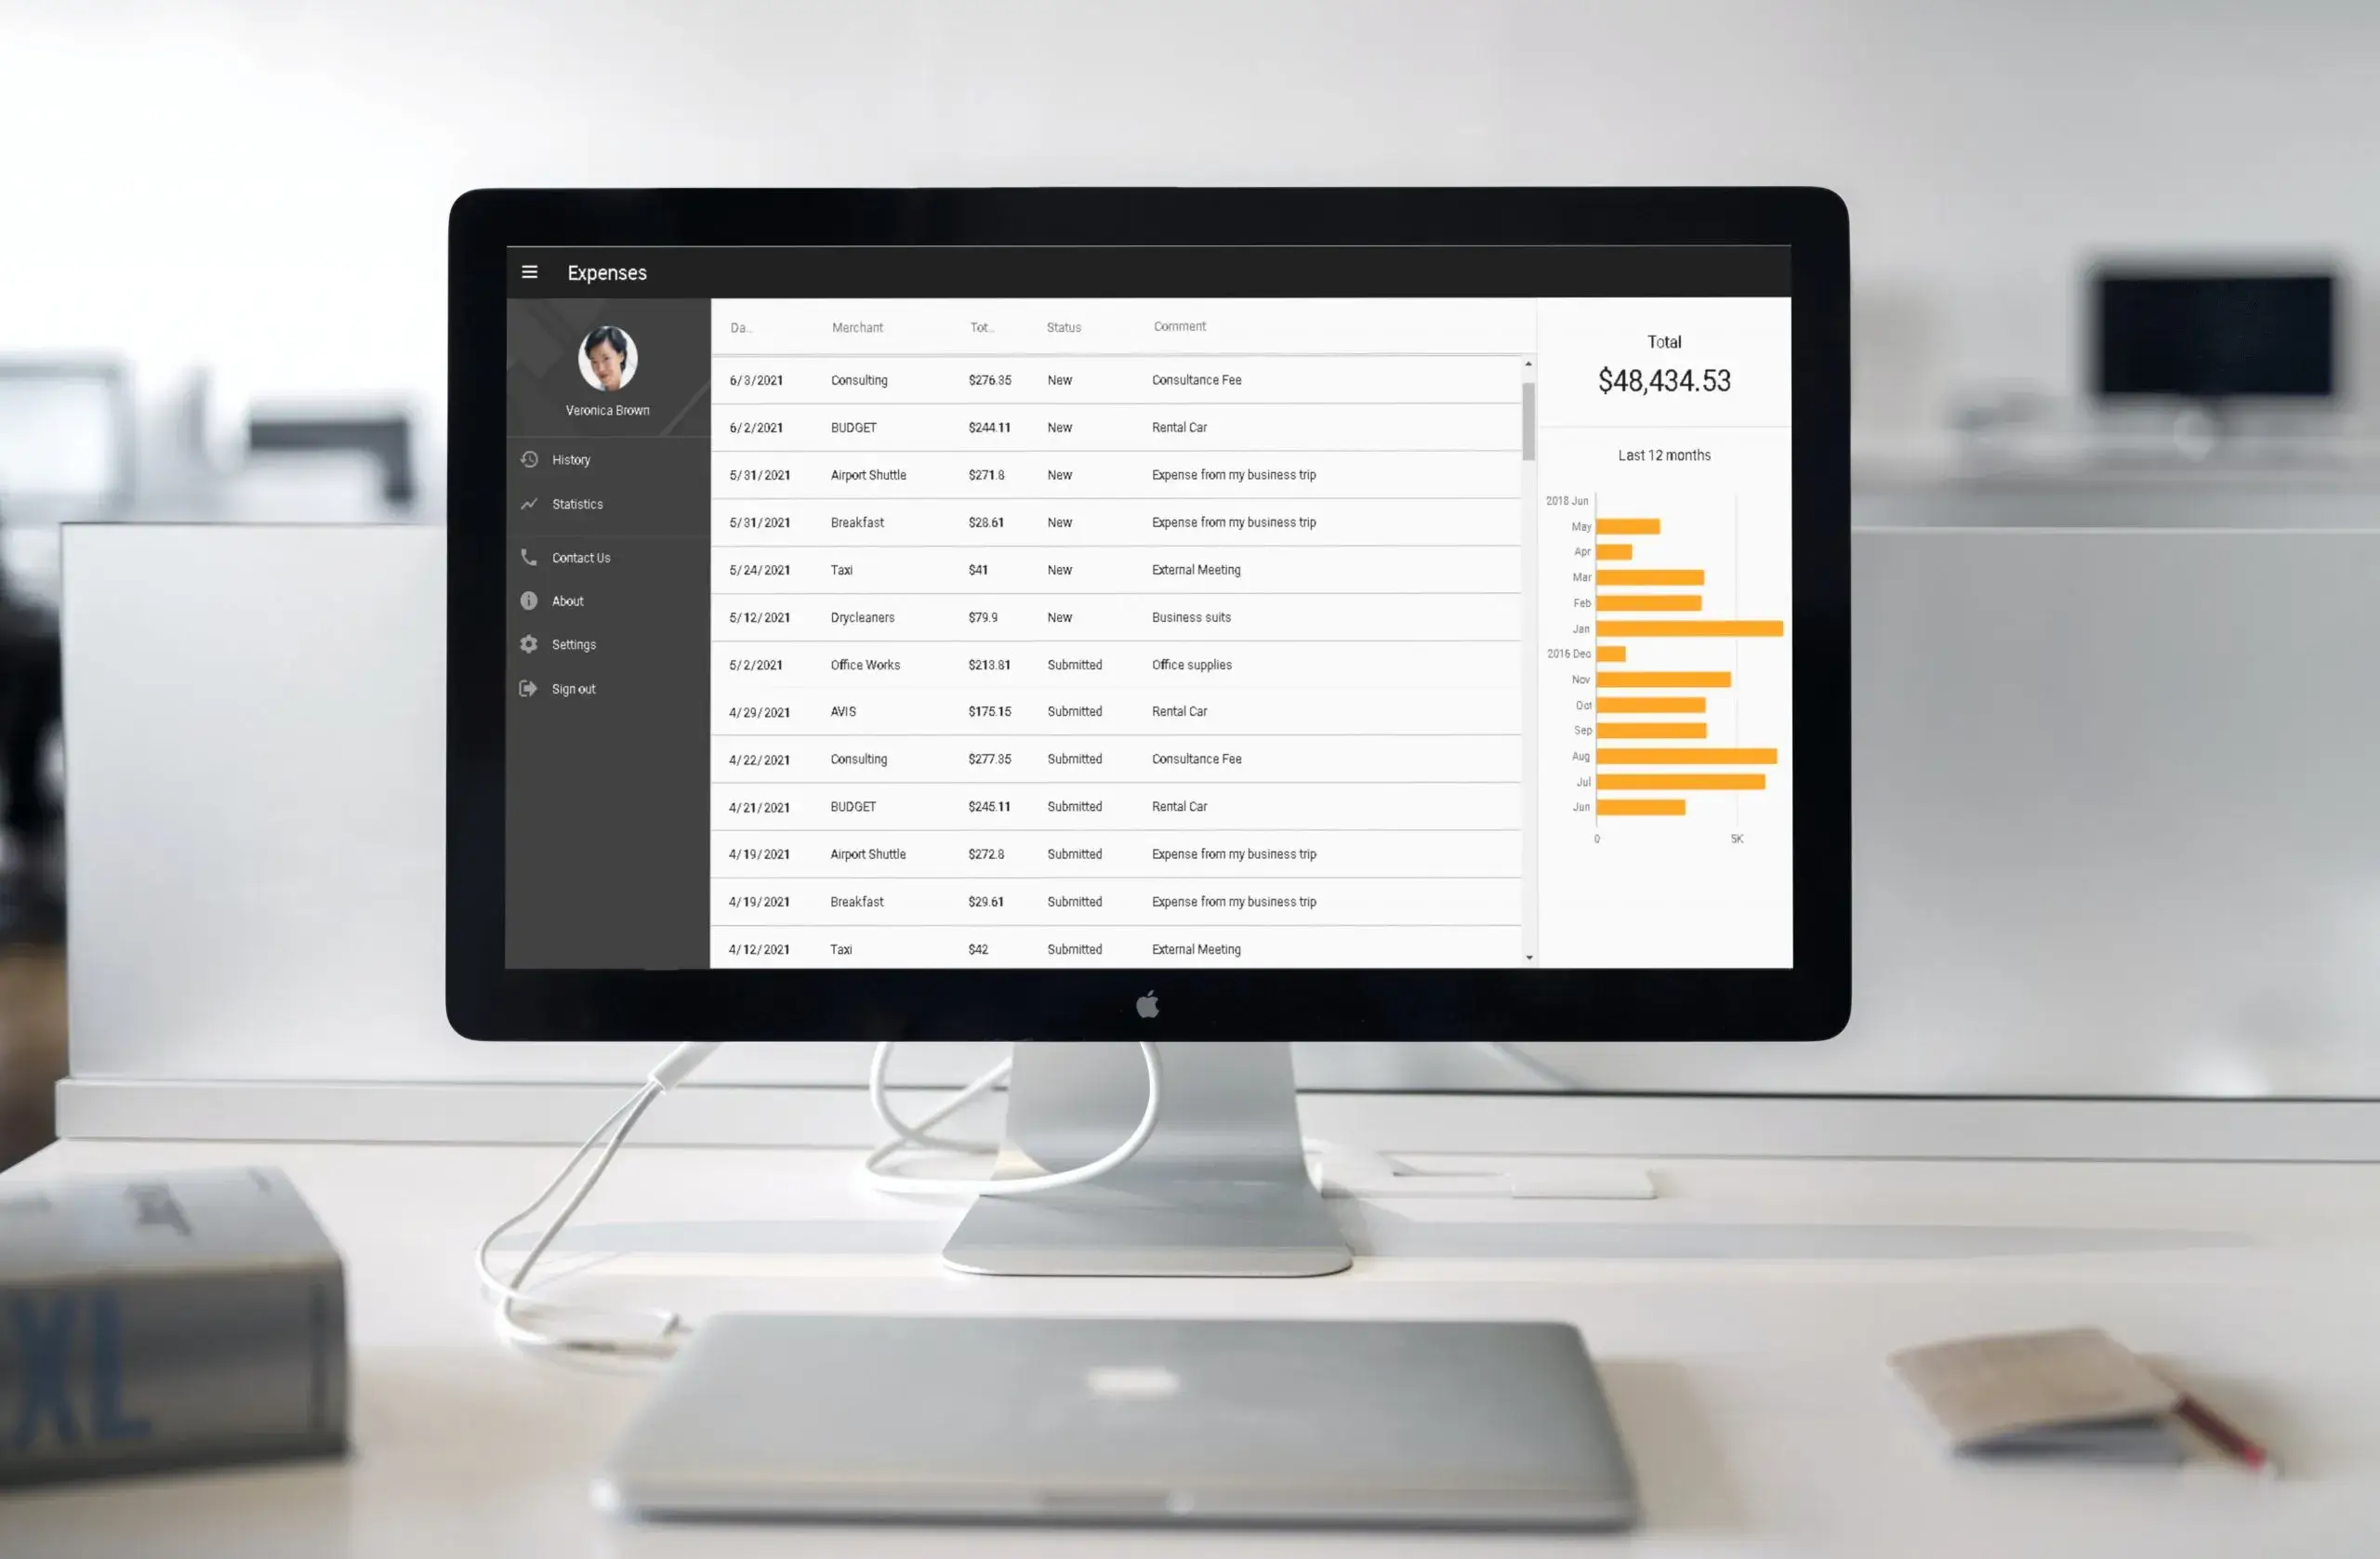
Example of Creating Powerful Data Visualization Using Visual LANSA
Why is Data Visualization important?
Data Visualization is in such demand because instead of making users scroll blindly through rows on a datasheet, they provide a visual summary of your information that is easier to read and also understand. This, in turn, makes it easier to identify important patterns and trends important to your business. In essence, the goal of data analysis is to determine which factors influence a company’s customers’ behavior. It also provides insights into the areas of your organization that need to be improved or prioritized.
Another factor to consider is that data is only valuable when it is visible. Simply put, if a data analyst consolidates insights from data, unless they use proper data visualization tools, it is, inevitably, more difficult to communicate its meaning. As a result, charts and graphs are extremely valuable for enabling data communication.
Using Visual LANSA for Building Powerful Logistics Data Visualizations With Low Code
The good news is that to gain an advantage, you can easily create Data Visualizations using Visual LANSA Low Code. Our visualizations enable your company to analyze your data and determine exactly how your business is performing. In addition, by visually interpreting your data using Visual LANSA, you can also identify and address issues as they occur. When all is said and done, data that is easily understood results in more informed and effective business decisions.
Watch the short demonstration on how Visual LANSA built Powerful Logistics Data Visualizations with low code:
The Success of Powerful Logistics Data Visualizations With Low Code
Companies that have achieved success Using Visual LANSA’s Low Code to Create and Implement Powerful Logistics Data Visualizations:
- Eagle replaces dispatch board with Visual LANSA
- Federated Group deploys Windows CMS portal
- Geodis Wilson Australia saves with Visual LANSA
- ITT-TDS saves money with LANSA
- Nulogx becomes more agile and responsive with LANSA
- DSI customers save with virtual supply chain solution
- Royal Wagenborg manages ship and shore with LANSA
- Walon boosts workshop productivity with LANSA
You can find all Case Studies right here!
How can I generate or modernize logistics reports easily?
With the visual LANSA point-and-click query builder, you can create your own queries easily with drag-and-drop. You simply choose the files you want to interrogate, nominate the fields you need for the report, and execute your query. There is no need to learn SQL to build the queries or filter your data for your results.
The advantages are clear with Visual LANSA you can:
LANSA’s query builder and reporting tool uses dynamic data grouping and summarizing to produce the query result data. Saving the query result data as a Microsoft Access database also allows you to integrate it with third-party reporting tools to extend reporting capabilities.
Ready to get started building logistics dashboards and data visualizations? Contact us!


